You now know how to build up a scripted Abaqus model and automatically evaluate its results. You might already have noticed that your very valuable Python file gets lost between all the result files. In this chapter, you learn to create a neat folder structure for your result files and delete result files that you do not need anymore. For your day-to-day work, this will be at least as important as being able to script your models.
Between all the copying of Abaqus commands, writing into a Python file, testing the script, and looking at results, one could get quite confused. Confused enough to delete the model file or to make some changes that break the model file: To stay safe, I advise you to look into version control, which can be done with Git. An introduction to this is given here, and you can also synch your model with the GitLab server of the University of Leoben (if you are either studying at or employed by the Montanuniversitaet) or sites like BitBucket or GitHub.
I) Run models in sub-folders
Changing the working directory of Abaqus (where your models are run and the rpy file is saved) is quite simple: You can just write os.chdir() and state the new path for the working directory in the brackets. This lets you work in a more structured way: Change into a results directory where you run your model and where you can delete files without worrying too much. So why didn’t we introduce this command two chapters ago? Because as you build your model, you will have lots of errors to deal with, as you are in your subfolder: Then, you would have to manually change back to your initial folder to make the execfile('model.py') command work again.
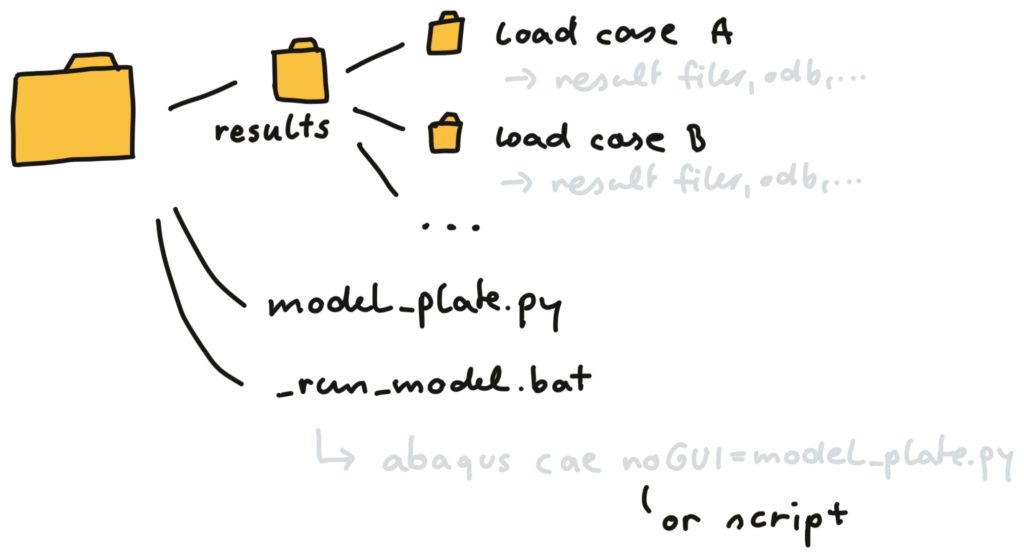
This is how a neat folder structure could look like. There is a results folder, containing result folders for all the load cases. Furthermore, we start running the Abaqus model by running a batch file (if you use Windows).
For your model, I suggest setting up a function that first clears the folder you want to work in (or create it), then changes into it, then does all your building and evaluating the model stuff, and then returns back to your initial directory:
import os, shutil

# absolut working path
DIR0 = os.path.abspath('')

# insert more parameters after run_folder
def create_model(run_folder):
    # delete folder if it exists
    if os.path.exists(dir_name):
        shutil.rmtree(dir_name)
    # create folder
    os.mkdir(dir_name)
    # go into folder
    os.chdir(dir_name)
    # model setup, run and evaluation
    # ...
    # go back to initial folder
    os.chdir(DIR0)
    returnCode language: Python (python)
You can adapt this function to build up, run and evaluate your model, but do so in a sub-folder that you can pass to the function as run_folder.
Note that directories in Python can be denoted by either
\\or/in Windows, but if you use/, this works both for Windows and Linux. So in the above example, you might pass the string'results/load_case_a'as therun_folder.
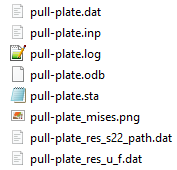
II) Deleting unwanted result files
With os.remove(), you can delete a file that you state in the brackets. For us, it can be interesting to delete files that have certain extensions like .stt and .mdl after the job has finished. We can use a for loop to find all the files with such endings and delete them. This is already a function with a default list of file types type_list:
def remove_files(dir0,type_list=('com','sim','prt','msg','reg')):
    # get all files and folders in dir0
    file_list = os.listdir(dir0)
    # go through the files and delete some of them
    for file in file_list:
        if file.split('.')[-1] in type_list:
            try:
                os.remove(dir0+'/'+file)
            except:
                print('file '+file+' could not be deleted!')
    returnCode language: Python (python)
You can directly copy this function into your model file. But be careful: os.remove() can be rather dangerous and delete stuff that you would like to keep. If you want to remove a folder and all its content, os.remove() does not work. For that, there is the rmtree function in the shutil module. If you try to delete a folder in that way, this will raise an error. So it is best to first check if the path exists with the command os.path.exists():
import shutil, os

# create folder (delete existing folder)
if os.path.exists(dir_name):
    shutil.rmtree(dir_name)Code language: Python (python)
III) Exporting and Importing Data
If you work with data science and Python, you use the module NumPy a lot. NumPy also has some neat functions for loading and saving NumPy arrays (those arrays need to have the same data type — string, float, integer, etc. — in all entries) with some very simple functions:
import numpy as np

# write the numpy array f_u_arr to a .dat ASCI file
np.savetxt('output.dat',f_u_arr)

# load a numpy array from a ASCI .dat file
f_u_arr_loaded = np.loadtxt('output.dat')Code language: Python (python)
These savetxt() and loadtxt() commands use ASCI files that can also be opened with a text editor. If you only want to store the data, not look at it directly and load it again with Python, you can use save() and load() instead of those commands to write to and read from binary files.
In some cases, it would be good to write something more complex than an array of similar strings, floats, or integers to a file. Maybe you have created a dictionary with all the step names as keys, and the maximum occurring stresses as the values. You can write this dictionary to a file or read a dictionary from such a file with the json module (note that such a dictionary cannot contain NumPy arrays):
import json

# write dictionary to dat-file
with file('output_dict.json','w') as f:
    json.dump(result_dict,f)

# read a dictionary from a json-formatted dat-file
with file('output_dict.json','r') as f:
    result_dict_loaded = json.load(f)Code language: Python (python)
IV) Plotting diagrams using Python
Once you get used to using Python also for data evaluation (which works really good), you can also think about drawing your diagrams using Python. There is a module for plotting data called matplotlib, which lets you plot nearly everything you like. Formatting the diagram in exactly the way you want it to look might take a while, but there is quite an elegance to having a Python file that creates your diagrams. And not an Origin (ok if you like clicking) or Excel (god beware!) file. If we have twelve thousand .dat files with similar formatting, we can make a small loop and just create twelve thousand diagrams. Or if we have new model results coming along, we just run the Python script and get our new diagrams.
This is a small example to start creating a simple diagram. Just write as many lines of ax.plot() as you want to plot multiple curves. If you do not understand some of the commands, play with them and/or look them up in the matplotlib documentation.
import numpy as np
import matplotlib.pyplot as plt

strain = np.linspace(0,1)
sigma = eps**2

fig,ax = plt.subplots(ncols=1,nrows=1,figsize=np.array((8.,5.))/2.54)

# realstring for special characters / latex formulas
ax.set_title(r'stress $\sigma$ over strain $\varepsilon$',fontsize=10)

# plot a curve, third argument is the format string ('r' for red)
ax.plot(strain, sigma, 'r', label='exp.')

# Colors: r:red, b:blue, g:green, c:cyan, m:magenta, y:yellow,
#         k:black, w:white
# Line styles: '-':solid, '--':dashed, '.':dotted, '^':triangles,
#              'o':big dots

# axis labels
ax.set_xlabel(r'eng. strain $\varepsilon_\mathrm{t}$')
ax.set_ylabel(r'eng. stress $\sigma_\mathrm{t}$')

# change the axis limits
ax.set_xlim(0,1)
ax.set_ylim(ymin=0)

# display a legend, set its title
leg = ax.legend(ncol=1)
leg.set_title('legend title', prop={'size':12})
# show a grid
ax.grid()

# fit diagram into image size
fig.tight_layout(pad=0)

# save as .png (dpi:resolution) or .pdf
fig.savefig('sig_eps.png', dpi=300)

fig.show() # display plot in Python
Code language: Python (python)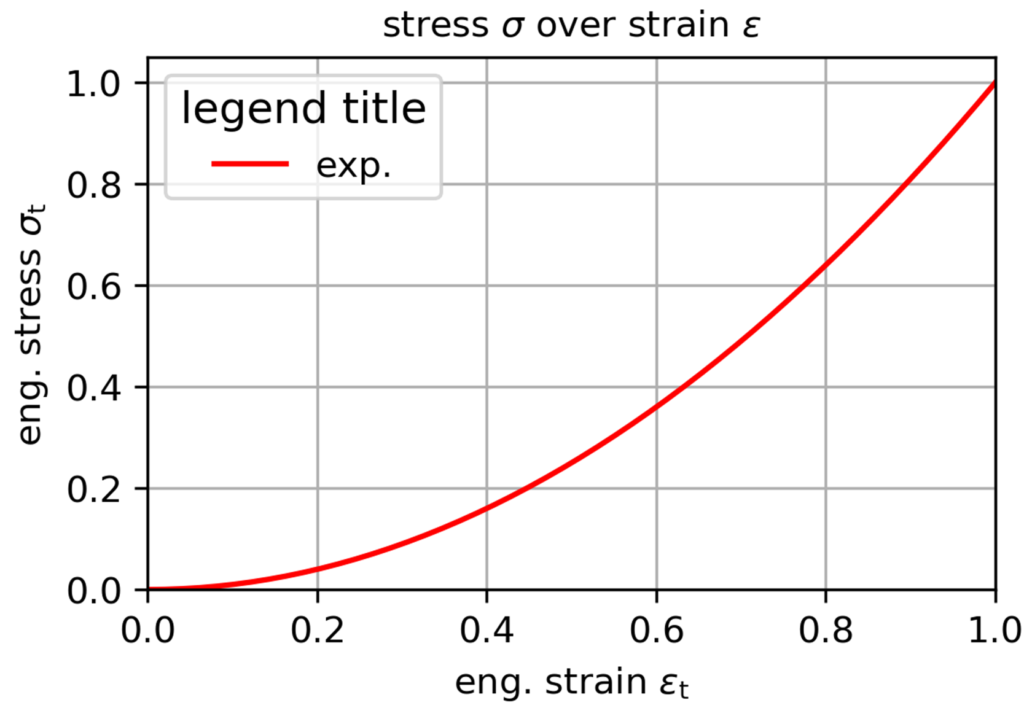
Where to go from here
I hope these pages were able to help you building your scripted Abaqus models. Additionally, I collected some cheatsheets on Python and scripting Abaqus models with python at this page. I tried keeping the course as simple as possible. If you noticed any errors or have suggestions for improving these pages, please let me know via email (martin.pletz@unileoben.ac.at) or write a comment on the main page of this course.
If you build a really nice model (and maybe even carried out some experiments for the problem), please show it to me.
Exercises
- Use your model from chapter 5 and adapt it so that it is run in a subfolder and all the unwanted Abaqus files like .prt, .msg etc. are deleted afterwards.
- Create a separate Python file or Jupyter Notebook for plotting model results. Use Python to access relevant result files of the model and plot them! Create plots that compare different sets of load parameters.